Debug vvvv plugins using visual studio 2005
This document shows how to use visual studio 2005 to debug plugins within vvvv itself, instead of using the Plugin Hoster.
- Create a new configuration
- Attach visual studio debugger to vvvv process
- Auto start vvvv when we start the debugger.
Create a new configuration
In order to be able to debug our plug-in from within vvvv, we need to set the build path to the Plugins folder.
Go to Build -> Configuration Manager
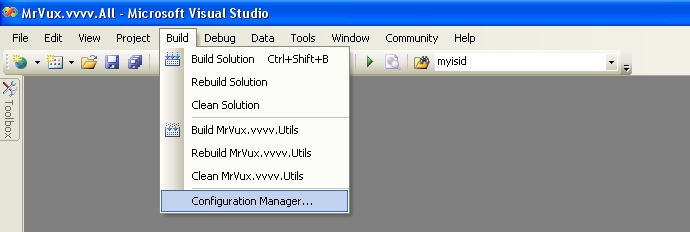
</img>
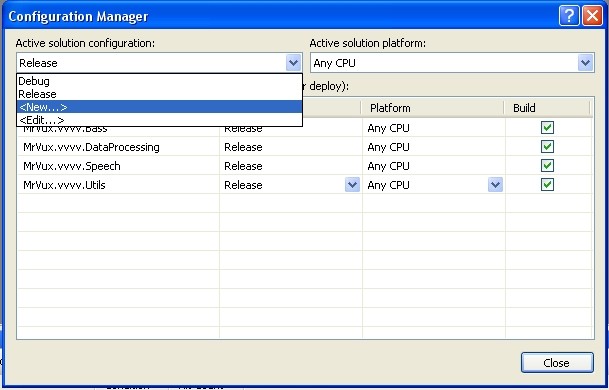
Within the Active configuration drop down, select : "<New...>"
Choose a name for your configuration (For example: vvvv-debug), and select "Debug" in the copy setting from drop down. Leave the check box checked.
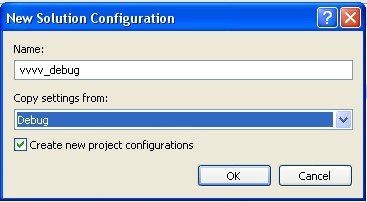
This allows us to keep our old configuration when we want to do test builds, and swap to vvvv-debug when we ready for testing.
Now we need to setup our path to be able to deploy our plug-in in the vvvv folder.
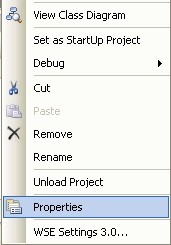
Right click on your project, then choose "Properties".
Go to the "build" section, and then choose your configuration.
On the "output path" section, choose the vvvv plug-in folder.
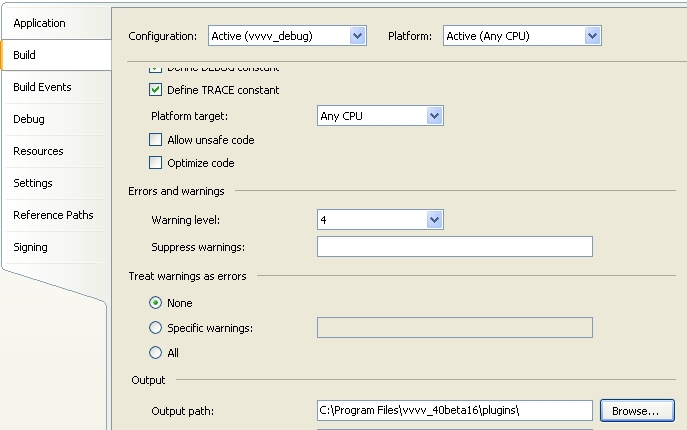
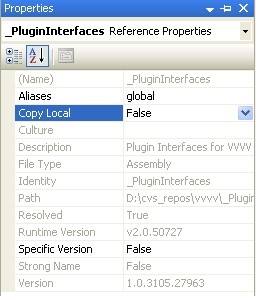
To avoid having duplicate libraries, I also recommend to setup the Utils and PluginInterfaces references “copy local” properties to "false".
Attach visual studio debugger to vvvv process
Now your configuration is ready, we will debug our project.
Put a couple of breakpoints in your plugin, and build you plugin with the configuration above.
(Note: make sure vvvv is closed before building, otherwise it will fail).
Run vvvv.
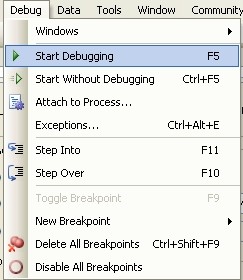
Go to "Debug" --> Attach to process
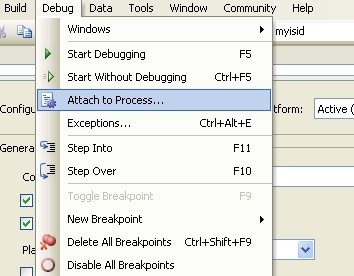
Choose "vvvv.exe" in the list, and then click on "Attach".
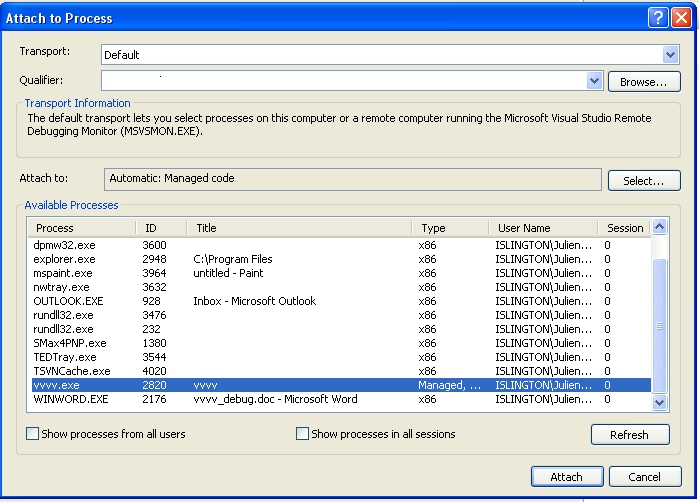
The debugger will start by itself. If you add your plug-in within the vvvv patch, you should be able to follow step by step what it does now :)
Auto start vvvv when we start the debugger.
To simplify our life, we will make visual studio start vvvv automatically when we start the debugger.
We go back to our project properties
Go to the debug section.
On the "Start Action" choice, choose: "Start Program".
Then browse to have the vvvv.exe file in the box.

Now when you will press the Start Debugging button, Visual studio will start vvvv and attach itself to the process.
When your stop the debugger, vvvv will also stop by itself.
by vux
anonymous user login

Shoutbox
~2d ago
~3d ago
~9d ago
~9d ago
~13d ago
~21d ago
~29d ago
~1mth ago